Showing 3 row(s)
| id | Sector | Stock | Name | Cap | EMA10 | EMA30 | EMA50 | EMA200 | MACD | LClose | 52WkH | D52WkH | A52WkH | dist | LLow | 52WkL | D52WkL | L3C | L3c_ALWk | HVol | Beta | MRS | Chart | fetchdate |
|---|---|---|---|---|---|---|---|---|---|---|---|---|---|---|---|---|---|---|---|---|---|---|---|---|
| 6 | Industrials | AAL | American Airlines Group, Inc. | 11.2 B | - | - | + | + | - | 16.96 | 19.10 | -11.20% | 17.15 | -1.11% | 16.51 | 9.07 | 86.99% | + | - | + | 1.04 | 0.62 | 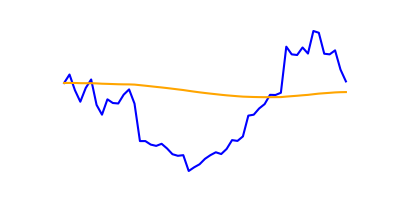 |
2025-02-06 |
| 10 | Industrials | AAON | AAON, Inc. | 9.3 B | - | - | - | + | - | 114.90 | 143.99 | -20.20% | 127.55 | -9.92% | 111.09 | 70.17 | 63.73% | - | - | + | 1.27 | 2.68 | 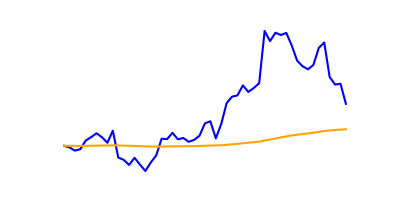 |
2025-02-06 |
| 25 | Industrials | ABM | ABM Industries Incorporated | 3.3 B | + | + | + | + | + | 53.10 | 59.21 | -10.32% | 53.16 | -0.11% | 52.82 | 38.89 | 36.54% | - | - | + | 0.74 | 1.48 | 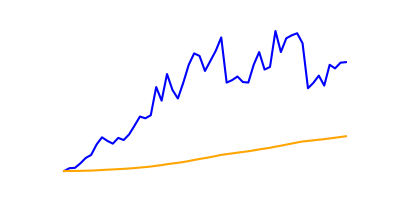 |
2025-02-06 |